Measurements Basic vTool#
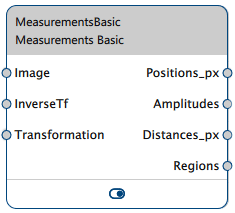
The Measurements vTool accepts an image via the Image input pin and outputs information about the edges found via its output pins.
If you use the Calibration vTool before measuring and connect the Transformation output/input pins of both vTools, the transformation data supplied by the Calibration vTool allows the Measurements vTool to output the positions and distances of the matches in world coordinates in meters (the Positions_m and Distances_m outpin pins become available).
If you use a Matching vTool and the Image Alignment vTool before measuring, you can measure objects that appear at positions that are different from your reference image. The transformation supplied via the InverseTf input pin allows the vTool to output the measurement results for the original input image.

How It Works#
By defining an image profile and applying it to your input image, you can gather the following information:
- Positions of edges
- Amplitudes of edges
- Distances between edges
- Regions with visualizations of the edges
Image Profile Definition#
In its simplest form, an image profile is a straight line with a length of x pixels and a width of 1 pixel. Along its length, the gray values in the image are captured in one-pixel-intervals. Mathematically speaking, an image profile is a function mapping a one-dimensional array of pixel positions onto their image gray values.
For better results, Basler recommends increasing the width of the profile to values above 1 pixel. Generally speaking, the wider the profile, the lower the effects of image noise. If you increase the width, the profile will essentially become a rectangle with the profile line running through the middle.
Individual profile values are generated by taking image pixels from above and below the profile line in equal proportion. To illustrate this, think of a profile with a width w. To generate profile values, w/2 pixels above the profile line and w/2 pixels below the profile line are considered.
Info
As a guideline, for small edges choose a profile width of at least 5 to 7 pixels.
You should also take into account that the positions of the edges may vary in vertical direction to the profile line. Basler recommends testing a few different images to see how large the variation of the objects actually is. Based on the results, you can choose the width of the profile. For instance, if the edge has a length of 50 pixels and the (orthogonal) object movement is 30 pixels, choose a profile width of 20 pixels.
Orient the rectangle such that the profile line is at a right angle to the edge.
Edge Detection#
An edge is defined as the position of the locally strongest absolute magnitude of the gradient. Commonly, the profile signal is smoothed by a low-pass filter. Use the Smoothing option to set the strength of the filter. If you want to measure tiny structures where the distances between the edges are small, e.g., 5 to 10 pixels, set a low smoothing value, e.g., 1.0. If the distances between the edges are large or in case of noisy images make smoothing stronger.
The local extrema of the gradient must be stronger than the Threshold value specified to be accepted as an edge. Try different threshold values to find the optimum setting. The optimum is somewhere between an upper value where all target edges are just detected and a lower value where unwanted edges are not detected anymore.
Edge Selection#
Edges have a positive or a negative gradient. This corresponds to the Amplitudes output. If the edge gradient is positive, the transition is dark to light. If the edge gradient is negative, the transition is light to dark. If you expect to only find transitions of one type with your application, set the Transition option accordingly.
If you want to measure just a single edge position, instead of setting the Select option to All, it may help to restrict the set of detected edges to just a single target edge. This would also make the application become more robust and other (undesired) edges in the profile area will be neglected. The single edge to select can be the first, the last, or the strongest (in terms of gradient magnitude) edge.
Using Calibration#
The resulting positions and distances can also be output in world coordinates in meters. To achieve this, connect the Transformation output pin of the Calibration vTool to the Measurements vTool's Transformation input pin.
Info
The measurement plane is the plane in which the edges to be measured lie in the 3-dimensional world. In every image to process, the edges have different positions within the measurement plane. Register this measurement plane by placing the calibration plate's surface in this measurement plane.
You have to use the same calibration configuration for setting up the Measurements vTool as for the actual processing.
Using Image Alignment#
The Measurements Basic vTool requires that the shape to be measured is always in the same position. Otherwise, detection will fail. To give you more flexibility, you can add a Matching vTool and the Image Alignment vTool to your recipe.
Matching is able to detect the desired shape at different positions in the input image compared to the reference image. It computes and outputs the alignment transformation data that the Image Alignment vTool then uses to provide an aligned input image to the Measurements Basic vTool. Now, the shape can be measured.
The Measurements Basic vTool also receives inverse transformation data with which it can output the correct position data for the input image instead of the aligned image.
Configuring the vTool#
To configure the Measurements vTool:

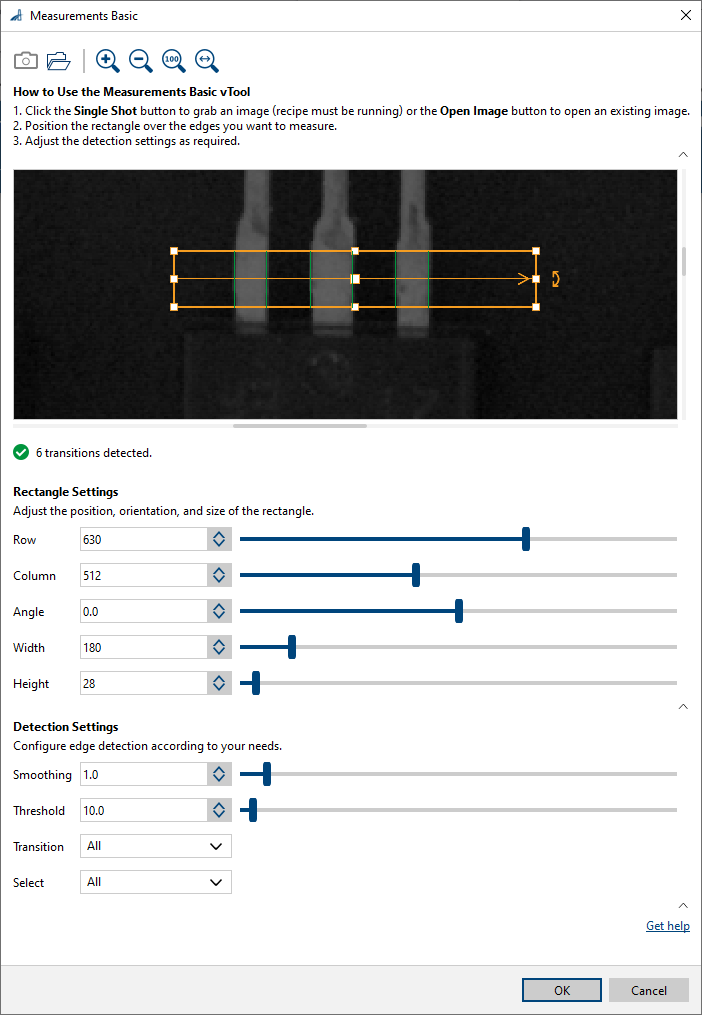
- In the Recipe Management pane in the vTool Settings area, click Open Settings or double-click the vTool.
The Measurements Basic dialog opens. - Capture or open an image.
- In the Rectangle Settings area, define the image profile by entering the values manually.
Alternatively, you can use the handles of the measurement rectangle to move, resize, and rotate it to fit the part of the image in which you want to measure.
A horizontal profile pointing from left to right has an angle of 0. - In the Detection Settings area, set Smoothing and Threshold to detect the edges in a robust and precise manner.
- Set Transition and Select such that only the target edges are selected.
You can view the result of the measurement in a pin data view. Here, you can select which outputs to display.
Inputs#
Image#
Accepts images directly from a Camera vTool or from a vTool that outputs images, e.g., the Image Format Converter vTool.
- Data type: Image
- Image format: 8-bit to 16-bit mono or color images. Color images are converted internally to mono images.
InverseTf#
Accepts the inverse transformation data of the alignment transformation. With this, the vTool can output correct position data for the input image instead of the aligned image.
- Data type: Transformation Data
Transformation#
Accepts transformation data from the Calibration vTool.
- Data type: Transformation Data
Outputs#
Positions_px#
Returns the edge points in image coordinates (row/column).
- Data type: PointF Array
Positions_m#
Returns the edge points in world coordinates in meters (x/y).
- Data type: PointF Array
Amplitudes#
Returns the amplitudes of the edges. Positive amplitudes indicate dark to light transitions. Negative amplitudes indicate light to dark transitions.
- Data type: Float Array
Distances_px#
Returns the distance between two adjacent edges in image coordinates (row/column). The number of distances is one less than the number of edges.
- Data type: Float Array
Distances_m#
Returns the distance between two adjacent edges in world coordinates in meters (x/y). The number of distances is one less than the number of edges.
- Data type: Float Array
Regions#
Returns a region for every edge found.
- Data type: Region Array